Why do countries with similar economic resources have different health outcomes? An evidence-led extension of Global Health Atlas, combining data audit, statistical reasoning, SQL and interactive D3.
HOLDOUT MAE1.99 yearsProcessed data; upstream leakage cannot be excluded
01 / ANALYSED
From Atlas to Intelligence
Global Health Atlas began as a five-chapter D3 application. This extension audits its assumptions, preserves its country exploration and rebuilds the analytical story around a specific question: what remains unexplained after accounting for economic resources?
The project combines interactive country exploration with a reproducible analytical workflow: data validation, economic-reference modelling, statistical analysis and predictive evaluation.
02 / ANALYSED
The analytical question
Which countries consistently sit above or below an economic reference for life expectancy? Investigate distributions, GDP relationships, persistent residuals, adjusted associations and later-year model errors. Each stage answers a different question.
The objective is transparent country comparison and analytical explanation. Residuals are not measures of healthcare efficiency or policy effectiveness.
03 / ANALYSED
A verified country-year panel
The dataset contains 2,864 rows, 21 columns and 179 country labels across 2000–2015. All 2,864 expected country-year combinations are present.
All numerical rows and regional labels match the publisher download one-to-one. Twenty-two country labels differ. Publisher metadata identifies the dataset as CC0 and attributes fields to WHO, World Bank and Our World in Data. GDP is current USD; schooling is mean formal-education years for adults aged 25+.
No duplicate country-years or explicit missing cells were found, and the documented range/flag checks passed. The original JavaScript parser nevertheless converted missing numerical values to zero. It now preserves missingness and true zeros. This correction does not change the complete dataset.
The original mortality pie summed overlapping and non-commensurable indicators. It was replaced with distributions and country comparisons. Country-average correlations remain available, but are distinguished from cross-sectional and repeated country-year analysis.
Completeness is not raw-data quality: the publisher filled missing observations with nearby-year and regional averages. Without imputation flags, we cannot exclude future or cross-group information already entering the values.
Portfolio case studyMethods · results · attribution · limits
A reproducible workflow from source verification to statistical analysis and interactive exploration.06 / ANALYSED
A world divided by years
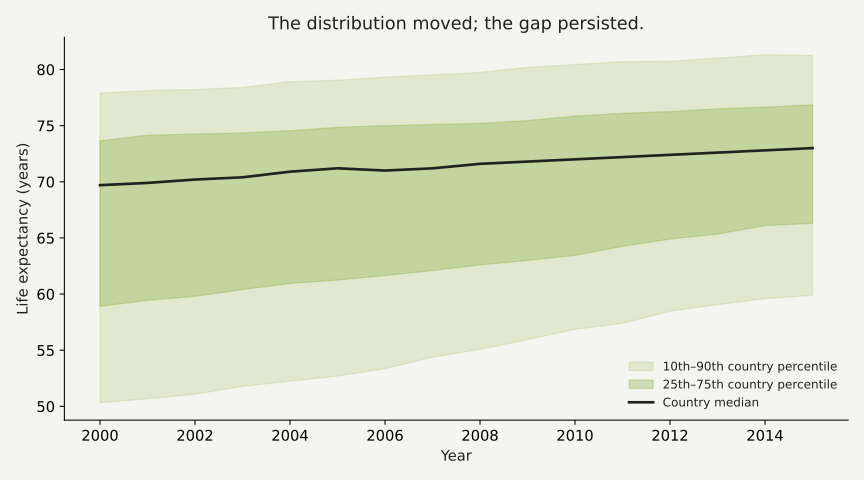
The distribution shifted, but large gaps remained.
Median country life expectancy rose from 69.7 to 73.0 years between 2000 and 2015.
The country-level 90th–10th percentile gap changed from 27.6 to 21.4 years.
Compare distributions, not a population-weighted world average.
Limit: Same 179 country labels; supplied processed values and national aggregates.
Country distributions through time
Equal weight per country. Bands show country spread, not confidence intervals or population-weighted world estimates.
Reusable SQLite queries calculate paired endpoint improvements, persistent gaps, coverage and year summaries. The schema enforces unique country-years and plausible core ranges. SQL outputs are generated and checked against the Python analytical table.
07 / ANALYSED
Money matters
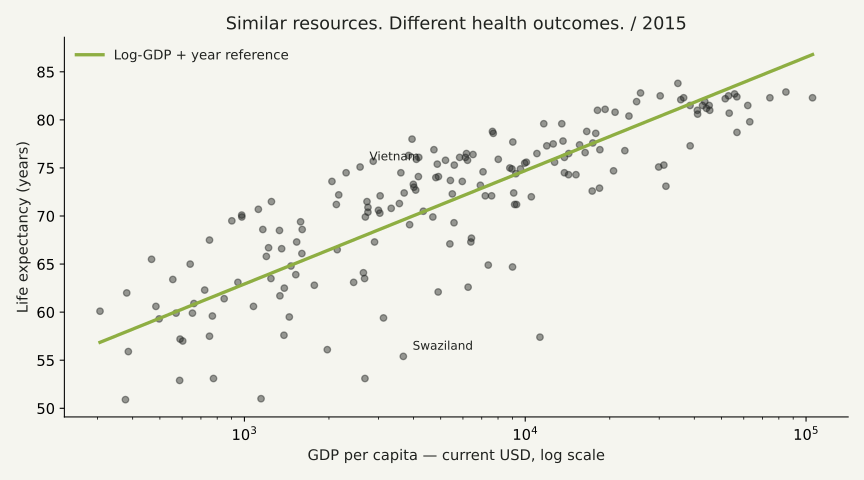
Economic resources have a nonlinear relationship with longevity.
In 2015, Pearson r was 0.63 for GDP and 0.82 for log GDP.
Spearman rank correlation was 0.85; each comparison uses 179 countries.
A log scale better reveals differences at lower GDP levels; neither coefficient establishes causation.
Limit: GDP is nominal current USD, not PPP; upstream imputation and ecological associations do not identify causal mechanisms.
GDP versus life expectancy / 2015
The prespecified descriptive baseline uses log GDP and year indicators across the full panel. Raw-GDP and quadratic-log alternatives are compared separately; this is not the predictive holdout model.
Descriptive model-form comparison
Specification
Adjusted R²
raw gdp
0.359
log gdp
0.643
quadratic log gdp
0.656
08 / ANALYSED
Money is not everything
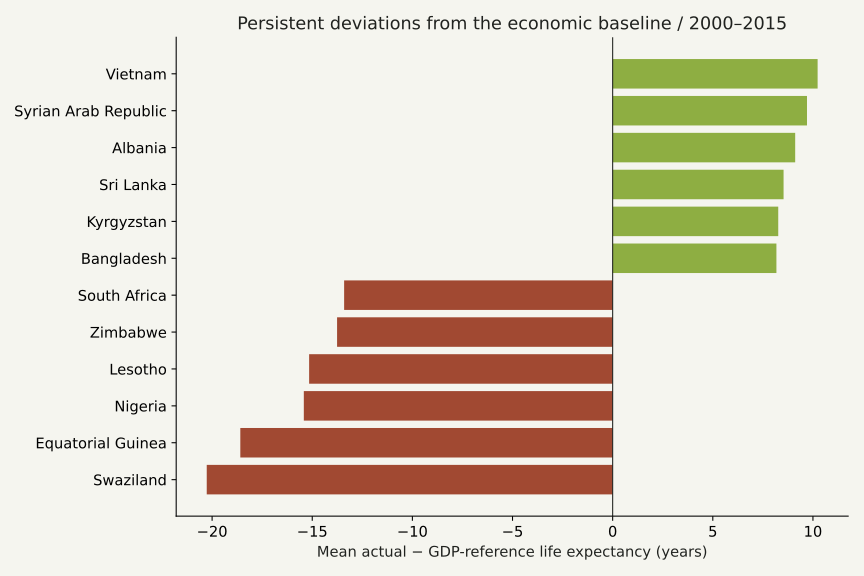
GDP does not exhaust the health-outcome differences.
The largest positive mean baseline residual belongs to Vietnam (+10.2 years); the largest negative to Swaziland (-20.3 years).
Mean over all 16 years relative to the same full-sample log-GDP + year-indicator baseline; median, persistence and volatility are also exported.
These are deviations from an economic reference, not rankings of healthcare efficiency.
Means over all 16 country observations. The interactive project also shows actual/reference trajectories, a selected-year residual map and exact data tables. Historical country labels are preserved.
The schooling coefficient was 0.40 life-expectancy years per additional schooling year (country-clustered 95% CI 0.09 to 0.72).
Conditional on log GDP, BMI, three immunisation fields and year indicators, using 2,864 country-year rows.
An adjusted ecological association, not the effect of an education intervention.
Limit: Polio/DTP VIFs exceed 11; overlapping predictors make individual vaccine coefficients unstable. Shared shocks, source imputation and omitted conditions remain.
Conditional model — country-clustered 95% intervals
Field
Coefficient
95% CI
log_gdp
3.249
2.587 to 3.912
Schooling
0.404
0.089 to 0.720
BMI
0.284
-0.139 to 0.707
Polio
0.128
0.021 to 0.236
Diphtheria
0.080
-0.036 to 0.195
Hepatitis_B
-0.047
-0.074 to -0.019
Models include year indicators but no country fixed effects. They mix between- and within-country associations. Polio/DTP3 VIFs exceed 11; individual vaccine coefficients should not be interpreted as intervention effects. Influence and heteroscedasticity diagnostics are exported.
10 / ANALYSED
Prediction with realistic boundaries
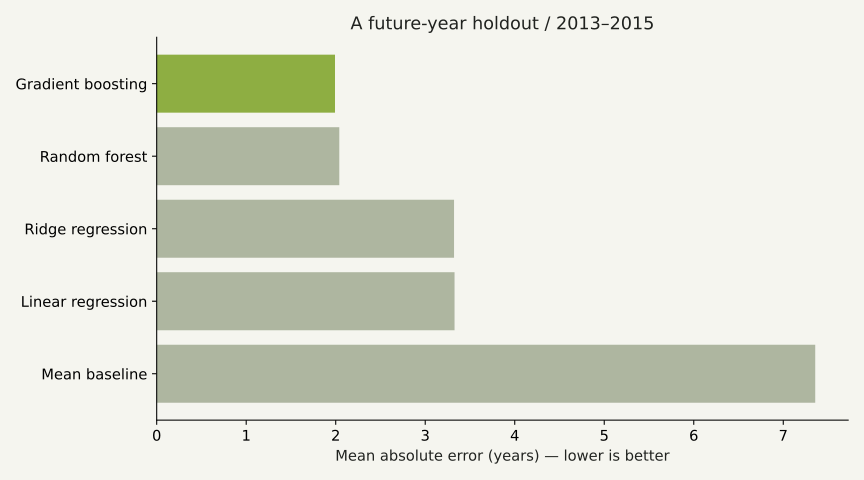
Temporal validation tests a harder question than random row splitting.
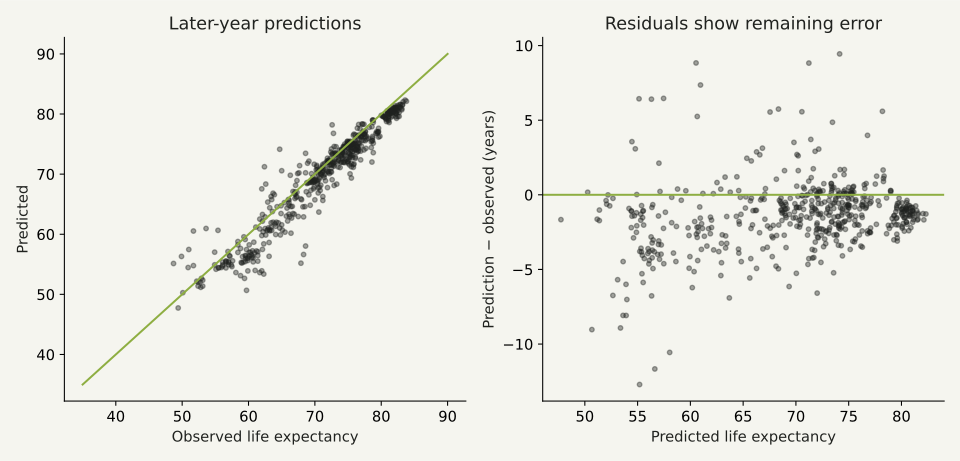
Gradient boosting achieved 1.99-year MAE on 2013–2015 (537 rows).
RMSE 2.71; R² 0.886. Family selected on 2011–2012; refitted on 2000–2012.
Contemporaneous covariates predict later-year outcomes for already observed countries.
Limit: This is not a forecast or causal model. Publisher three-year/regional imputation may include future information; upstream leakage cannot be excluded.
Ten contemporaneous features are used. Country IDs, region, year, mortality outcomes, HIV and economy flags are excluded from the primary predictor set. Training preprocessing is fitted inside each pipeline, but cannot undo the publisher’s earlier imputation.
Temporal test: 2013–2015
Model
MAE / years
RMSE / years
R²
Mean baseline
7.36
8.51
-0.128
Linear regression
3.33
4.22
0.723
Ridge regression
3.32
4.22
0.723
Random forest
2.04
2.85
0.874
Gradient boosting
1.99
2.71
0.886
Baseline and model comparison
Train 2000–2010, select family on 2011–2012, refit 2000–2012, test 2013–2015. Model family is selected by validation MAE before viewing test results.
A separate geographic stress test holds out 36 countries and gives 2.31-year MAE (Gradient boosting). Selection uses only the 143 training countries. This is an across-country historical test, not a future-year test; regional source imputation may cross the split.
11 / ANALYSED
Interpretation and remaining error
Predictions and residuals
Country/year error, bias and largest errors are exported. Aggregate accuracy does not mean every country is well estimated.
Largest country-level temporal test MAE: Cambodia, 11.65 years. The fixed-model country-block bootstrap 95% interval for overall MAE is 1.77–2.25 years; it excludes source and selection uncertainty.
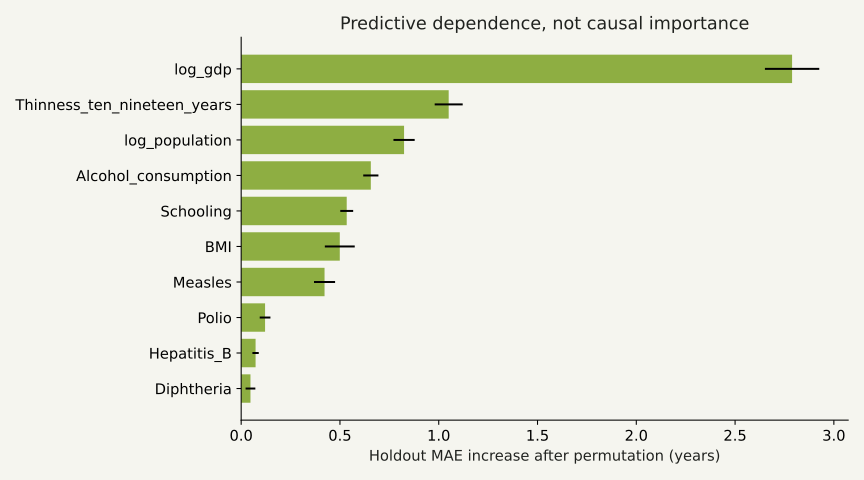
Predictive dependence, not policy importance
15 permutations per feature with seed 42. Correlated features can share/mask importance. No causal interpretation.
The six-chapter D3 experience separates world distributions, economic resources, baseline gaps, contextual associations, prediction and findings. Select a year and country to inspect the GDP scatter, actual/reference readout, maps and country trajectory.
All 179 country labels resolve uniquely to local world-atlas geometry using explicit aliases and name normalisation. Missing/unmatched observations have a neutral state; exact values and a native country selector/table provide alternatives to hover. Charts redraw for viewport changes; no autoplay or long entrance animations are used.
The publisher used nearby-year and regional-average imputation without cell-level flags. Future or cross-country information may already be present, so holdout results cannot establish leakage-free prospective accuracy.
National aggregates conceal within-country differences. Country-level associations and residuals do not establish individual-level or causal effects.
GDP is nominal current USD, not PPP. Residuals depend on model form, omitted variables and upstream reconstruction; they do not measure healthcare efficiency.
Predictors are contemporaneous. The temporal test uses countries seen earlier; the geographic stress test covers historical years. Neither establishes current or multi-step forecast performance.
The next analytical improvement is reconstructing source observations with imputation flags and training-only preprocessing. Then test baseline sensitivity and repeated temporal/geographic folds. Within-country modelling should follow a clear question and a defensible panel design.
14 / ANALYSED
Project resources
Global Health Atlas combines interactive D3 country exploration with reproducible Python/SQL analysis, economic-reference modelling and predictive evaluation.
The GitHub repository and public deployment contain Global Health Atlas. The source download also includes the extended Python/SQL analysis, evaluation reports and interactive country comparisons.